
Federal Congressional Districts in Ohio
These fact sheets explore demographics, economic stability, food security, housing, education and employment, health, and funding sources in each of Ohio's 15 Federal Congressional Districts. Data from 2025. Check out the interactive worksheet.

Share these fact sheets
Source Document
Datafile
Methodology
Federal funding helps to support safety net programs such as SNAP and Head Start, but also to fund non-profits, higher education, and small businesses.
District 11, encompassing most of Cuyahoga County, received 10% of the federal funding coming into Ohio.

The Department of Education provided the most resources to Ohio in 2021, at $14 billion. Most of this money was allocated to school districts and higher education for emergency support to assist during the pandemic. Excluding pandemic-related aid, Federal Pell Grants was the largest line item.
What about key public benefits programs?
More than 124,000 people in District 6 rely on Social Security. This is approaching 40 percent of residents, more than anywhere in the state
Ohio's aging population is most clear in District 6 and District 14 where older adults ages 65 and above outnumber children under age 18.
Statewide, more than 75% of SNAP recipients are in working families
In Districts 3 and 7 more than 80% of people who received SNAP live in a family where at least one adult is employed.
Over one-quarter of people in Districts 1, 3, 9, 13, and 14 who have health coverage via Medicaid are part of Medicaid expansion
What about poverty?
Looking at poverty in Ohio, children younger than 18, and especially those younger than age 5 are the largest group below the poverty threshold. District 11 exceeds those statistics.

What about workforce and unemployment?
In Ohio, 60% of the population is employed. While the Federal government employs the smallest share of the workforce, cuts to Federal jobs in Ohio could be far-reaching and problematic.
- For profit or self-employed 77.2%
- Non-profit 10.0%
- Federal government 2.0%
- State government 3.1%
- Local government 7.8%
There are almost 114,000 federal employees that live in Ohio.
Ohio’s Congressional District 10 has the largest federal workforce with almost 20,000 employees, likely due to the Wright Patterson Air Force Base. If all federal jobs were cut in Congressional District 11, the unemployment rate would be 12 percent.
If all federal employees in Ohio lost their jobs, the unemployment rate would jump to 6.7 percent statewide from the current rate of 4.8 percent.
Federal employees support the labor force in every congressional district in Ohio. In some districts, the unemployment rate would almost double if all federal employees were subject to governmental efficiency cuts.
Explore Topics
Browse articles, research reports, and testimony.


.png)
Explore more fact sheets
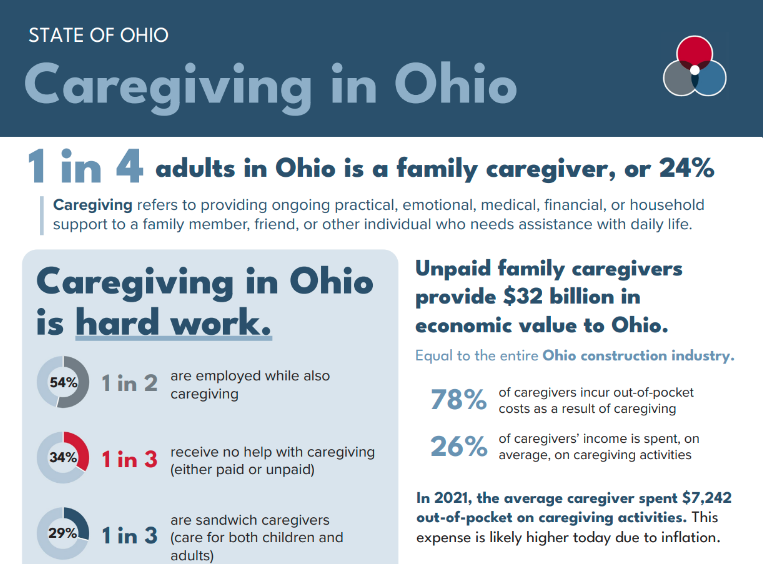
Caregiving by Ohio Legislative District
Caregiving is hard work. It can be an invisible second job for many family caregivers, keeping their loved ones safe, healthy, and out of a nursing facility. The shift toward community-based services was a deliberate policy choice, better for patients and saves Ohio Medicaid millions of dollars each year. Find your district at the Ohio Secretary of State.
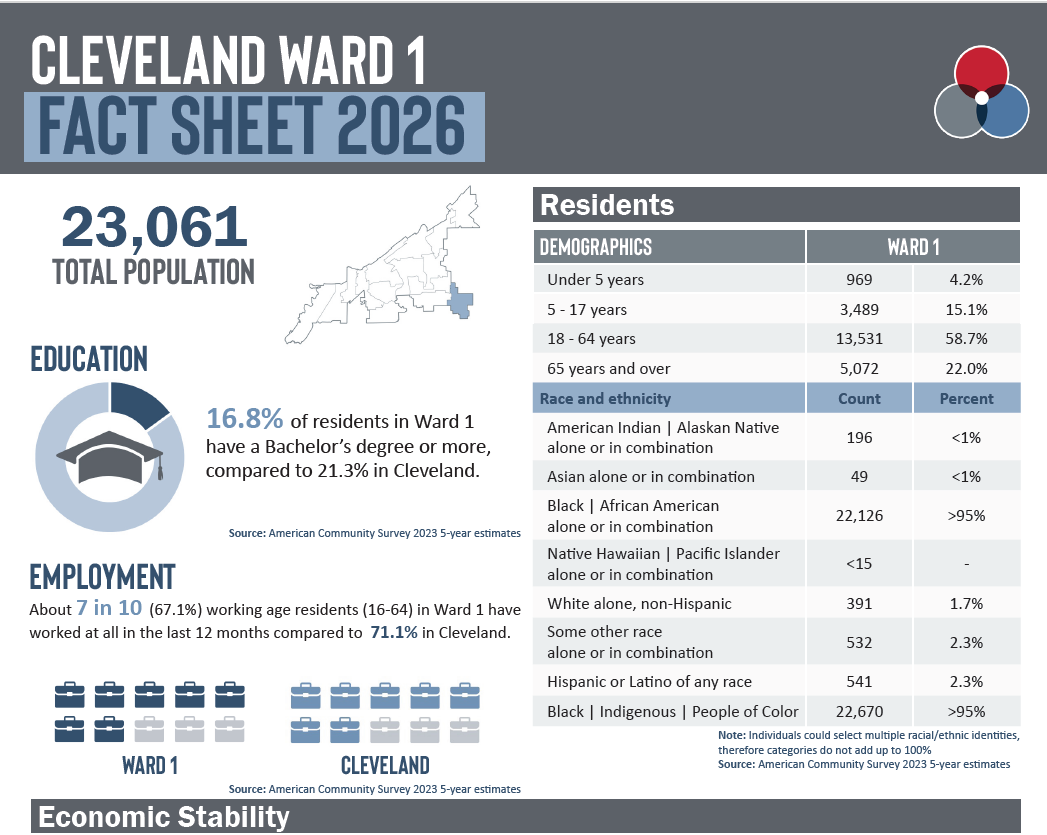
Cleveland Wards 2026
Cleveland Ward fact sheets and data profiles highlight demographic, health, and social indicators in the new 15 wards in Cleveland. The fact sheets summarize and the data profiles provide extensive information about each ward on employment and income, poverty, education, housing and health. This is the first analysis available for Cleveland's revised wards, now 15 from the prior 17. Data released 2025.

Medicaid in Ohio by County
More than 25 percent of Ohio's population receives health care coverage from Medicaid. These fact sheets explore those covered populations, work requirements, and the potential for coverage loss if policy or funding changes are made to the program. Data released 2025.