Explore topics and analysis from Community Solutions
Public testimony and policy analysis are the foundations of our policy advocacy work. Research includes reports, consulting, data analysis, and fact sheets. Browse our work by topic, type, or author.
Explore the fact sheets
We make data digestible. Community Solutions produces fact sheets highlighting demographic, health, and social indicators for communities around Ohio. We examine data indicators within poverty, education, employment, income, health outcomes, and public benefit programs. Policymakers and direct service organizations use this resource to better understand the communities they serve and advocate for improved health and social conditions around the state.

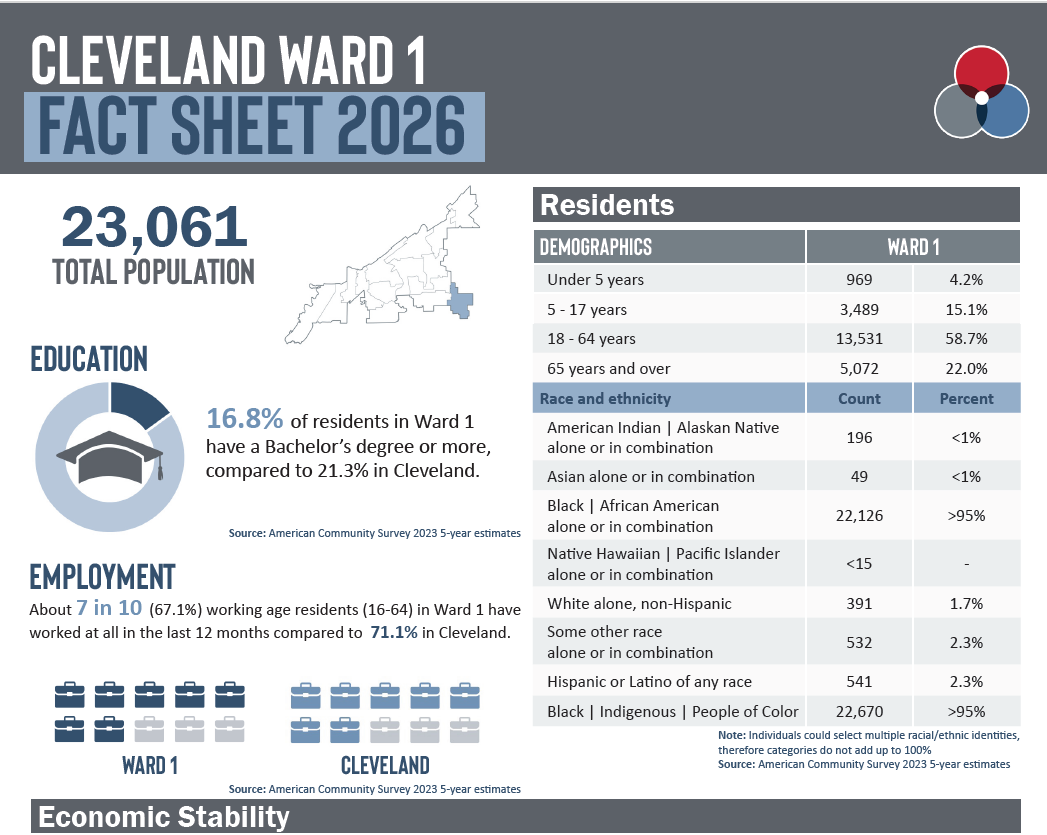
Cleveland Wards 2026
Cleveland Ward fact sheets and data profiles highlight demographic, health, and social indicators in the new 15 wards in Cleveland. The fact sheets summarize and the data profiles provide extensive information about each ward on employment and income, poverty, education, housing and health. This is the first analysis available for Cleveland's revised wards, now 15 from the prior 17. Data released 2025.

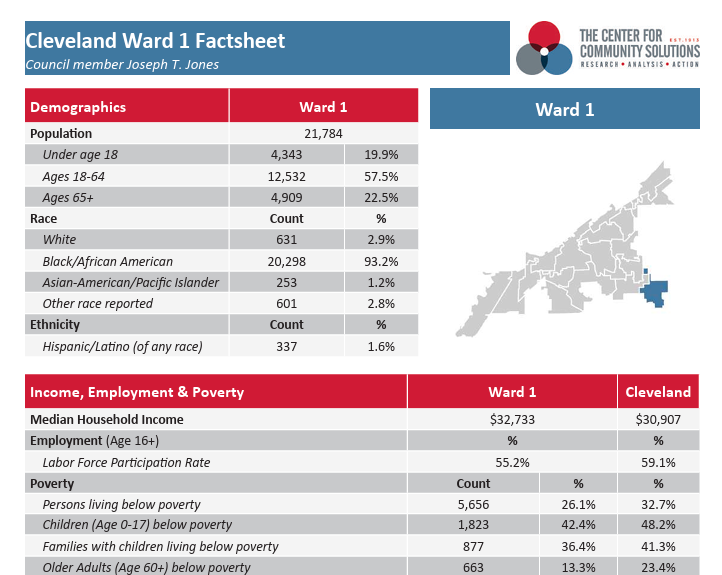
Cleveland Wards 2022
City of Cleveland Ward fact sheets highlight pre-pandemic demographic, health, and social indicators in the City of Cleveland. The fact sheets include basic demographic information about each neighborhood and pre-pandemic data on employment and income, poverty, education, housing and health. Data released 2021 and 2022. Updated with new ward configuration in 2026.

Federal Congressional Districts in Ohio
These fact sheets explore demographics, economic stability, food security, housing, education and employment, health, and funding sources in each of Ohio's 15 Federal Congressional Districts. Data from 2025. Check out the interactive worksheet.

Cuyahoga County Council Districts
Cuyahoga Council District fact sheets highlight demographic, health, and social indicators in the City of Cleveland. The fact sheets summarize and the data profiles provide extensive information about each district on employment and income, poverty, education, housing, and health. Data released 2017 and 2024.

Cleveland Neighborhoods
City of Cleveland Neighborhoods fact sheets and data profiles highlight demographic, health, and social indicators in the City of Cleveland. The fact sheets summarize and the data profiles provide extensive information about each neighborhood on employment and income, poverty, education, housing and health. Data released in 2016, 2021, and 2024.

Cuyahoga County Municipalities
These fact sheets and data profiles highlight demographic, health, and social indicators in the cities, townships, and villages of Cuyahoga County. The fact sheets summarize and the data profiles provide extensive information about each Municipality on employment and income, poverty, education, housing, and health. Data released 2018 and 2024.

