Updated data on health insurance coverage, poverty, and income released by the U.S. Census Bureau and Bureau of Labor Statistics represents the “before” conditions: before passage of H.R. 1 with its sweeping changes to SNAP and Medicaid and before the war in Iraq and tariffs impacted prices in the broader economy.
The 2025 Current Population Survey Data released on September 15, 2026 was collected 18 months earlier, in March 2025 after the flurry of executive orders following inauguration and resulting federal policy shift.
Since the Census Bureau has announced an indefinite delay in the release of updated American Community Survey data, we can only guess whether the trends in Ohio mirror these national trends. We have the Current Population Survey (CPS), and the data show some improvement.
Gains show up in the data, yet challenges persist
The CPS reports on official poverty measure and the supplemental poverty measure for the country as a whole. The number and rate of Americans living in poverty was lower and incomes were higher. More people had health insurance coverage. There are no state, county, or city data. Very few of the year-over-year changes are statistically significant but examining trends allows us to have an indication of whether conditions are getting better or worse.
According to the new data, there were about 1.5 million fewer Americans living in poverty in 2025 than 2024 for a national official poverty rate of 10.2 percent.
Differences between population groups persist. Poverty rate for non-Hispanic white Americans was 7.5 percent, compared to 17.3 percent for Black Americans and 13.9 percent for people who are Hispanic of any race.
Median income rose from $85,210 in 2024 to $87,460 in 2025, an increase of 2.6 percent which is slightly below the average annual price inflation. Despite these improvements, more than 1.9 million Americans between the ages of 18 and 64 worked full time for the full year and still didn’t earn enough to be above poverty. An additional 4.9 million worked at least part time for at least part of the year.
Earnings continue to reflect an uneven recovery
Median earnings, a subset of income that includes compensation received for work such as wages, salaries, tips, overtime, and commissions, increased for men and women, every age cohort, and people in each race and ethnic category. Median earnings dropped slightly for workers who completed some college or with a bachelor’s degree or higher. Wage gaps persist.
Women who worked full time for the full year earned, on average, 83.9 cents for every dollar men earned, a slight improvement from 2024. The wage gap for full-time Black workers remained at 73.4 cents for every dollar earned by non-Hispanic white workers. The Gap grew for Hispanic workers, and in 2025 these full-time workers earned just 68.6 cents for every dollar a white worker earned, down from 70.8 cents the year before. ICE raids had only just begun when this data was collected.
Data capture health coverage before major coverage changes take effect
Several months after this data were collected, Congress enacted H.R. 1 (sometimes called the “One Big Beautiful Bill Act”). The Congressional Budget Office estimated that the provisions related to health insurance would cause 10 million more Americans to be uninsured within the next decade. Most would be the result of Medicaid changes. Insurance losses will start slow as H.R.1’s provisions go into effect. The largest single-year jump is expected in 2027 after Medicaid work requirements and other changes are implemented.
More than 5 million Americans are expected to lose health insurance because of H.R. 1 in 2027 alone.
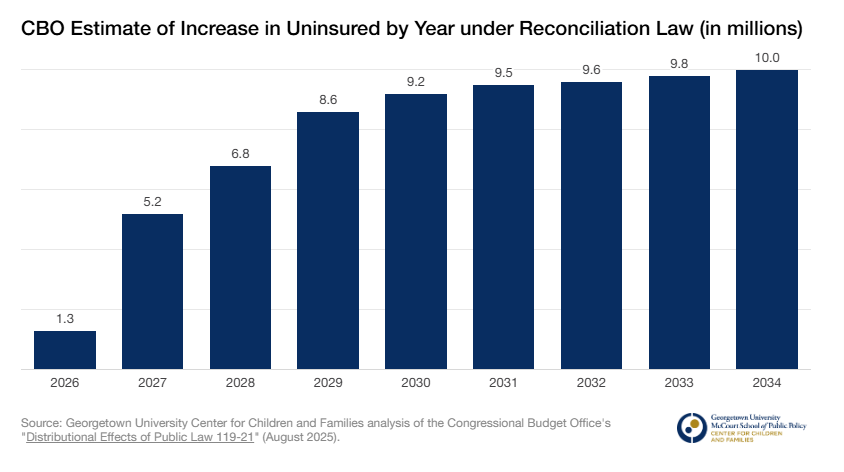
The data released this month will be the “before” benchmarkwe use when examining what happens with health insurance and coverage.
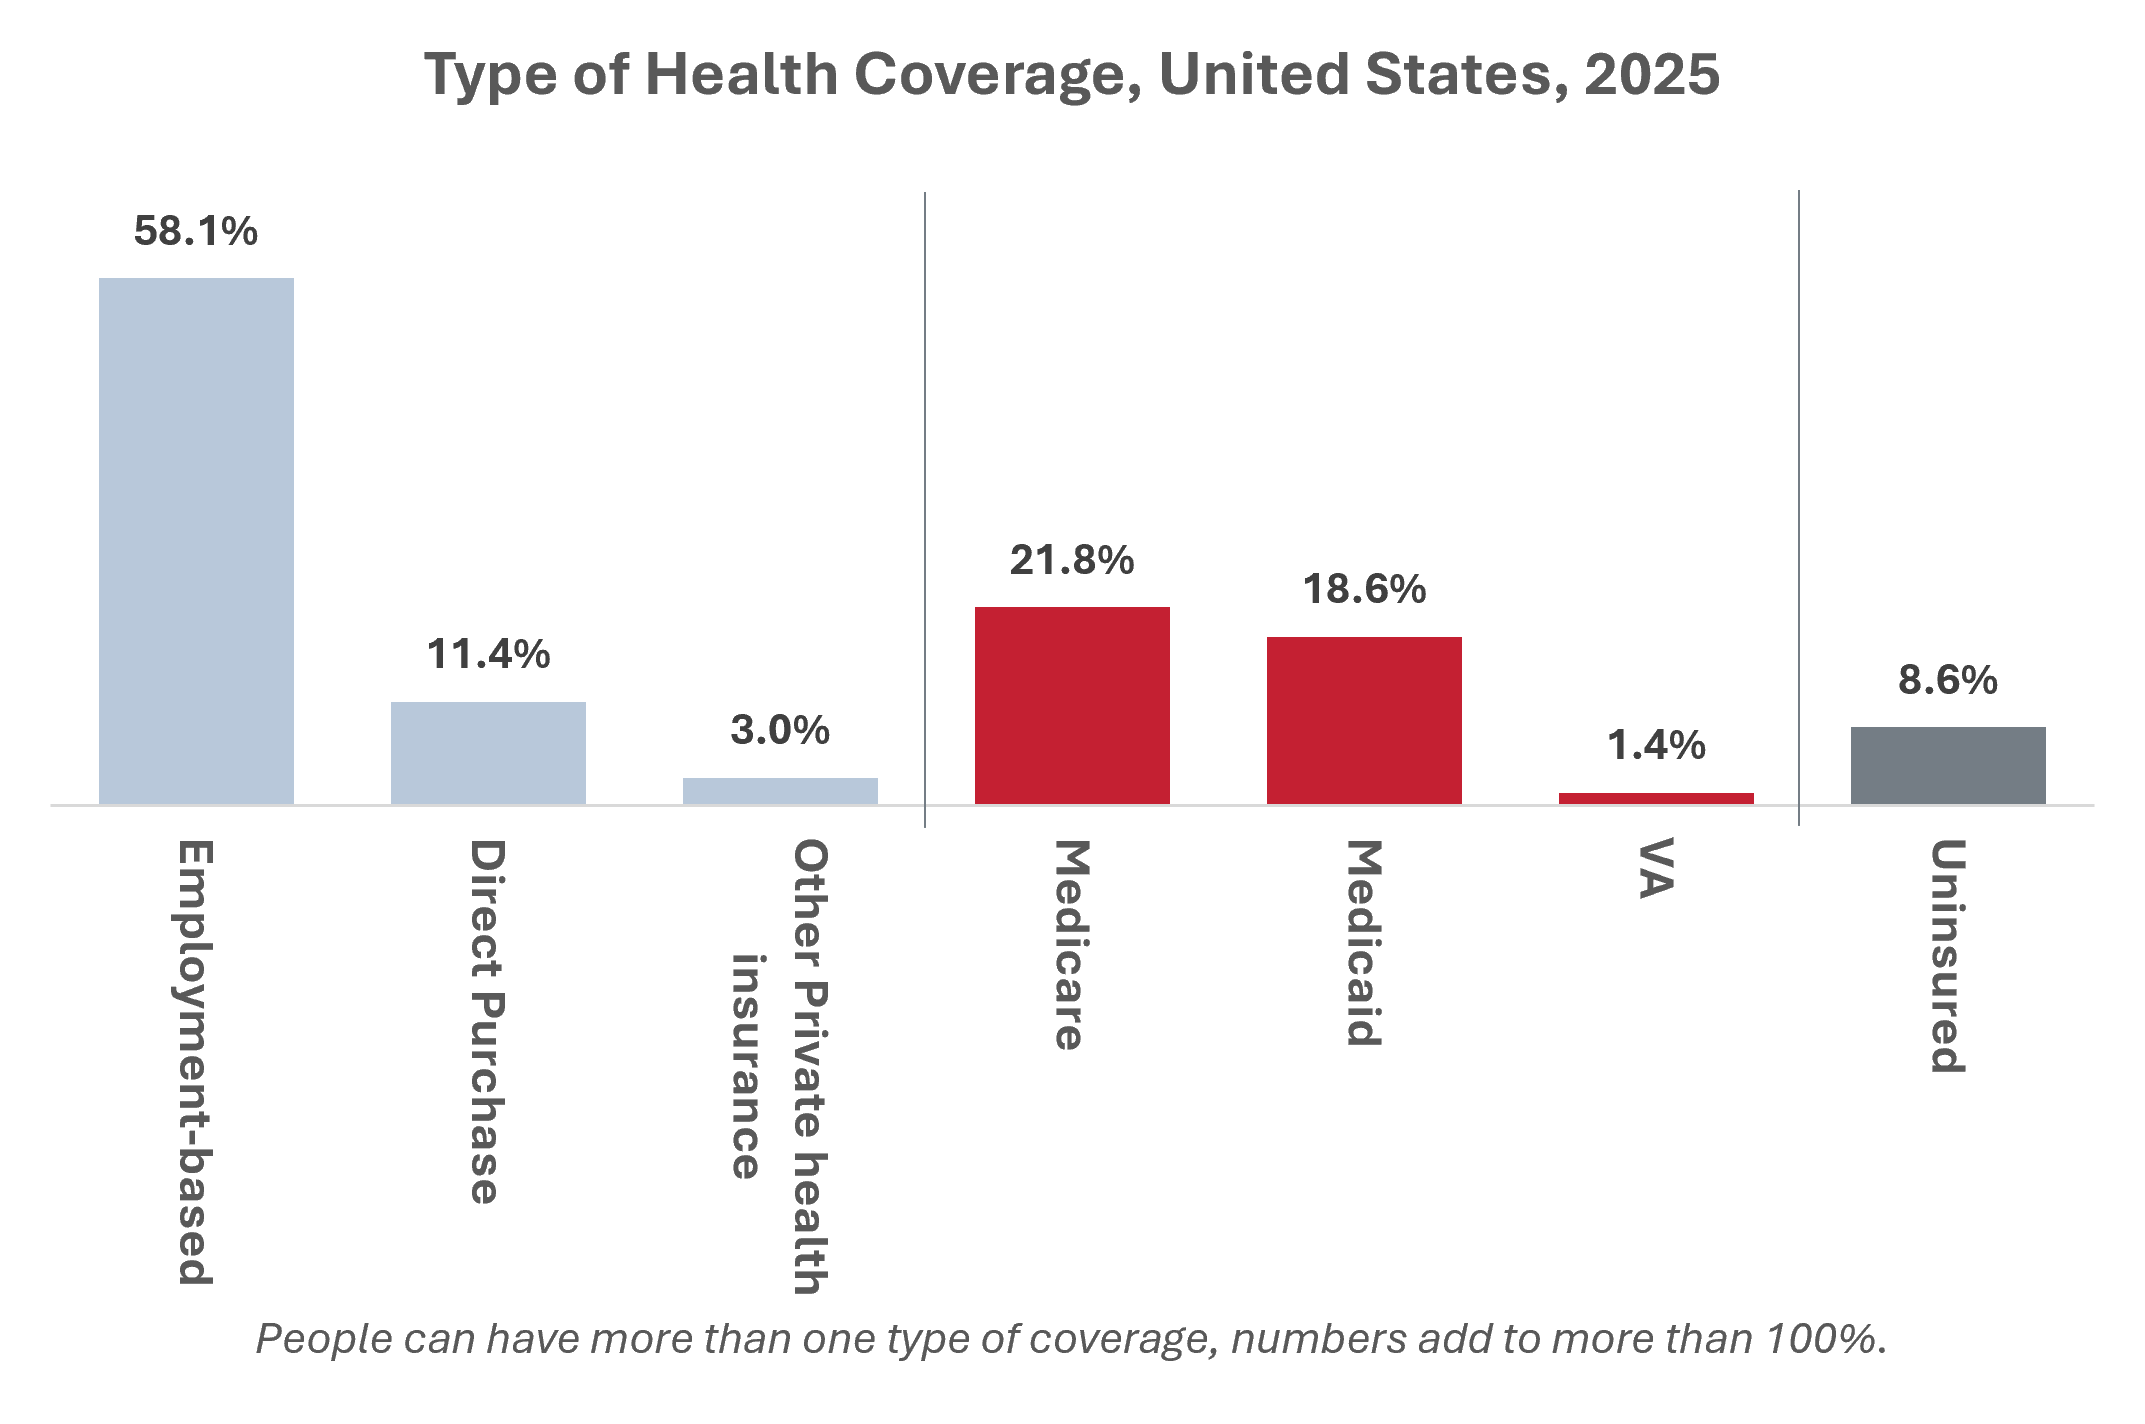
In 2025, 220 million Americans had private insurance, most of which was employer-based. Less than half as many, 121 million relied on public health insurance including Medicare (64.9 million), Medicaid (57.8million) and VA (4.2 million).
For at least a decade, the number and share of people covered by Medicare has been increasing, the result of demographic changes and an aging population. Medicaid coverage increased during the pandemic but has fallen each year since 2023.
Early indications are that federal policy changes may already be having the intended impact, even before they are fully implemented. In Ohio alone, there are 201,500 fewer people covered by Medicaid in July 2026 than there were a year earlier, a 10.5 percent decrease. We don’t know why.
What comes next is anyone’s guess
Time, and subsequent data releases, will tell how recent developments in public policy and the broader economy impact conditions facing families and communities. We hope that the Census Bureau and Bureau of Labor Statistics continues to collect, analyze, and release the gold-standard data we have come to rely on to understand what is happening in communities and allocate resources strategically. Only then will we know if policy change is having its intended effects.