Cuyahoga County Council Districts
Cuyahoga Council District fact sheets highlight demographic, health, and social indicators in the City of Cleveland. The fact sheets summarize and the data profiles provide extensive information about each district on employment and income, poverty, education, housing, and health. Data released 2017 and 2024.

Share these fact sheets
Source Document
Datafile
View the excel spreadsheet with 9 sources, 25 Census tables, and 179 data points.
Methodology
View the 20-page pdf examining unique data points on health, employment, economic stability, education, housing, and neighborhood conditions.
Methodology highlights
These 2024 County Council District fact sheets and data profiles present meaningful data from trusted sources such as the Census American Community Survey, the Center for Disease Control, Ohio Department of Health, The National Center for Education Statistics, The Institute of Health Metrics and Evaluation, and Feeding America, among others.
Data was typically accessed at the census tract level, and then apportioned into Cuyahoga County Council Districts using a rigorous methodology developed in partnership with Cleveland State University’s Northern Ohio Data and Information Service.
As is the case with all publicly available data, these numbers and percentages must be understood as estimates, and estimates alone will never be able to tell the full story of Cuyahoga County’s Council Districts. However relevant and recent data is critical, and we hope these fact sheets help inform your work.
Questions about the data sources or how estimates were calculated? Check out our methodology. Learn more about why we changed the way we report on race.
These 2024 fact sheets and data profiles were made possible with generous support from the Cleveland Foundation.
Explore Topics
Browse articles, research reports, and testimony.
Explore more fact sheets

Cleveland Wards 2026
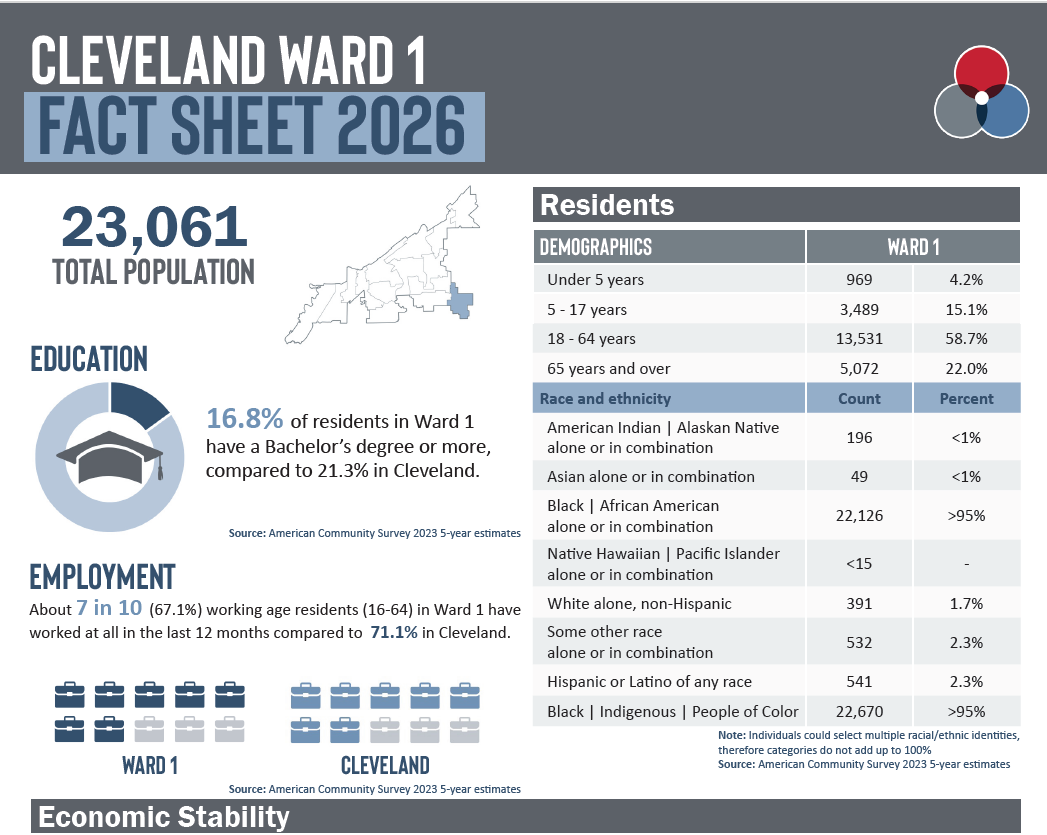
Cleveland Ward fact sheets and data profiles highlight demographic, health, and social indicators in the new 15 wards in Cleveland. The fact sheets summarize and the data profiles provide extensive information about each ward on employment and income, poverty, education, housing and health. This is the first analysis available for Cleveland's revised wards, now 15 from the prior 17. Data released 2025.

Federal Congressional Districts in Ohio
These fact sheets explore demographics, economic stability, food security, housing, education and employment, health, and funding sources in each of Ohio's 15 Federal Congressional Districts. Data from 2025. Check out the interactive worksheet.

Medicaid in Ohio by County
More than 25 percent of Ohio's population receives health care coverage from Medicaid. These fact sheets explore those covered populations, work requirements, and the potential for coverage loss if policy or funding changes are made to the program. Data released 2025.


