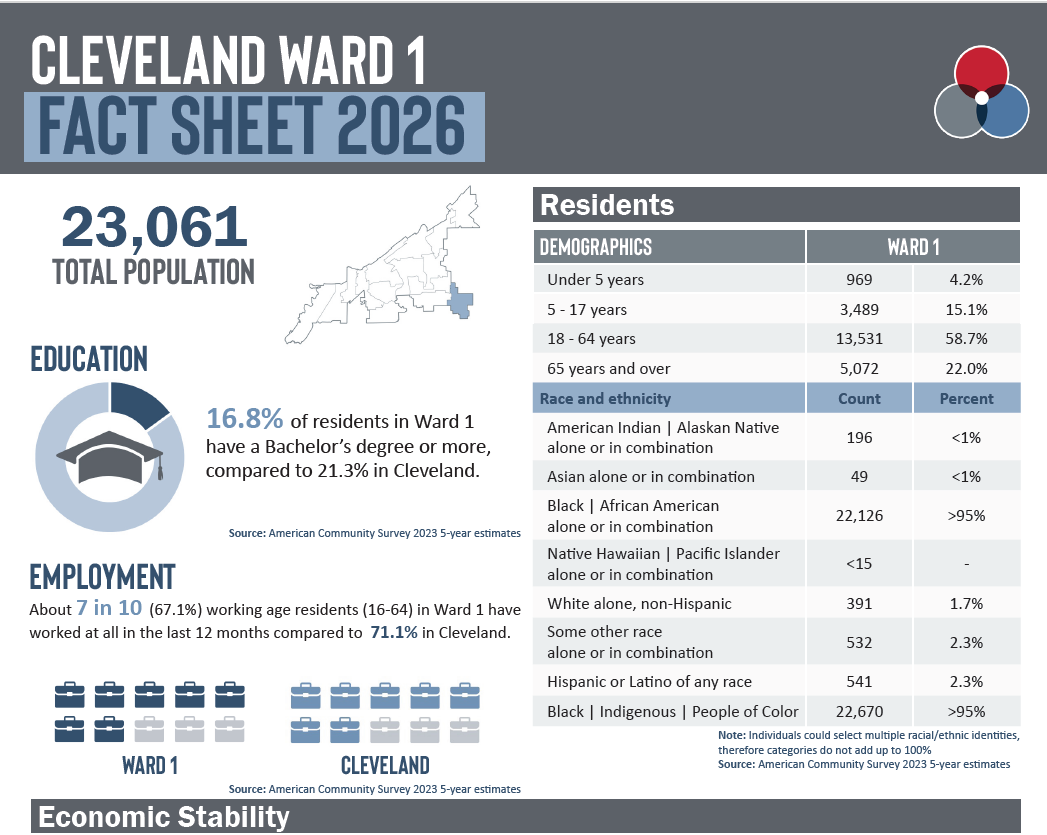
The new 2024 neighborhood and district fact sheets are here! As residents, community leaders, and policy makers digest the data, there’s one data point that could generate some confusion. Almost all the feedback we received from our internal and external reviewers pointed out that our racial demographic data does not add up to 100%. It might helpful to explain why we calculated race the way we did.
Yes, the numbers don’t add up to 100 percent
In research, we’ve been conditioned to expect population estimates to add up to 100 percent. By their very nature, it’s an estimate of a population, 100 percent of it! Or at least some percent of it, and then the rest of the data is reported as missing or adjusted to still add up to 100 percent. But when population estimates add up to more than 100 percent, it can feel counterintuitive.
Not everyone falls into the tidy, exclusive, demographic categories that divvy up and describe the population.
Reporting race data (or any demographic data really) can be far less straightforward than it may seem. Not everyone falls into the tidy, exclusive, demographic categories that divvy up and describe the population. Those categories have always been subjective and culturally influenced, and are constantly changing. When we try to force people into tidy categories, we lose important insight.
Race calculations should retain nuance and unmask racial disparities
Race is a social construct used to divide populations often based on appearance, social factors, and cultural backgrounds. It is typically reported as the percentage of individuals who are entirely of one race, and anyone who is multiracial would be categorized as such, and anyone who didn’t fit into the predetermined racial categories would be considered “other.” This is indeed tidy, adds up to 100 percent, and is how most of our previous fact sheets have reported race. What is lost however, is the racial information of anyone who is two or more races, a demographic of individuals that has grown exponentially in the last decade.
Race is a social construct used to divide populations often based on appearance, social factors, and cultural backgrounds.
It’s not just about lost nuance, though. Research has found that categorizing people as multiracial can actually mask racial disparities and undercount indigenous American and Hawaiian. In Cleveland, 8.2%, and in Cuyahoga County, 5.7% of the population identify as two or more races. So, to report demographics more reflective of local geographies, we chose to report race as the number of individuals that reported themselves as either entirely of that racial category or a part of that racial category.
Using this method, someone who is, for example, Asian and Black, would be reported once as Asian, and once as Black, as opposed to being counted once as the catchall “Two or more Races” category. This is why our totals go over 100 percent! The one key exception to this is the non-Hispanic white alone category in the fact sheets. We report this category as non-Hispanic white alone, because race was constructed to be a hierarchical human-grouping system, and culturally the privileges associated with “whiteness” were typically only afforded to individuals with two white parents.
This is similar to why we reported a Black Indigenous and People of Color category. While BIPOC as a categorization tool has flaws in trying to categorize too many disparate experiences under one umbrella, it is still a culturally relevant category.
Reporting race this way offers more insight into the demographic composition of our local geographies. The one limitation to this method, however, is that by detailing what multiracial individuals’ specific racial identities are, we’ve lost the specific count of individuals who are multiracial. This limitation is solvable with some additional in-depth analysis, below.

Census insights into Cleveland’s multiracial population
There are 30,506 Cleveland residents who identify as two or more races. While the census doesn’t provide detailed information on residents who identify as three races (n=2,757) or four or more races (n=413), it does offer some insight into individuals who are biracial (n=27,336). The most common biracial identity in Cleveland is Black and white (38 percent). The second most common biracial identity is White and Some Other Race (34%). This is almost certainly a reflection of the census doing a poor job of capturing Hispanic identities, and indeed in Cleveland 88% of the 14,716 residents who identified as “Some Other Race” in the census was of Hispanic or Latino ethnicity.
The census is working to improve the way they capture Hispanic/Latino ethnicity in the near future. So, this biracial identity might be better understood as largely Hispanic/Latino and white. Similarly, the third most common biracial identity, Black and some other race, might also be understood to be largely Black and Hispanic or Latino. The next most common biracial identities in Cleveland were American Indian Alaskan Native and Black, as well as American Indian Alaskan Native and White.
These numbers may also be the result of a data quirk; according to Indigenous demography expert Dr. Carolyn Liebler, there is compelling evidence that changes in the way the Census captured data on race caused the number of individuals reporting their racial identities as American Indian to nearly double from 2010 to 2020.
Cleveland biracial population

The numbers in Cuyahoga County are mostly similar, except all Black biracial identities are a slightly smaller percentage, and there is a greater percentage of Asian and white biracial residents.
Cuyahoga County biracial population

This additional analysis shows that, for the 8.2% of residents in Cleveland, and 5.7% of residents in Cuyahoga County, their racial identities are largely pairings of Black and white, Hispanic/Latino and white, and Hispanic/Latino and Black. Specifically in the County, 12.3% of biracial identities are Asian and white.